- 您现在的位置:买卖IC网 > Sheet目录503 > RCD080N25TL (Rohm Semiconductor)MOSFET N-CH 250V 8A SOT-428
RCD080N25
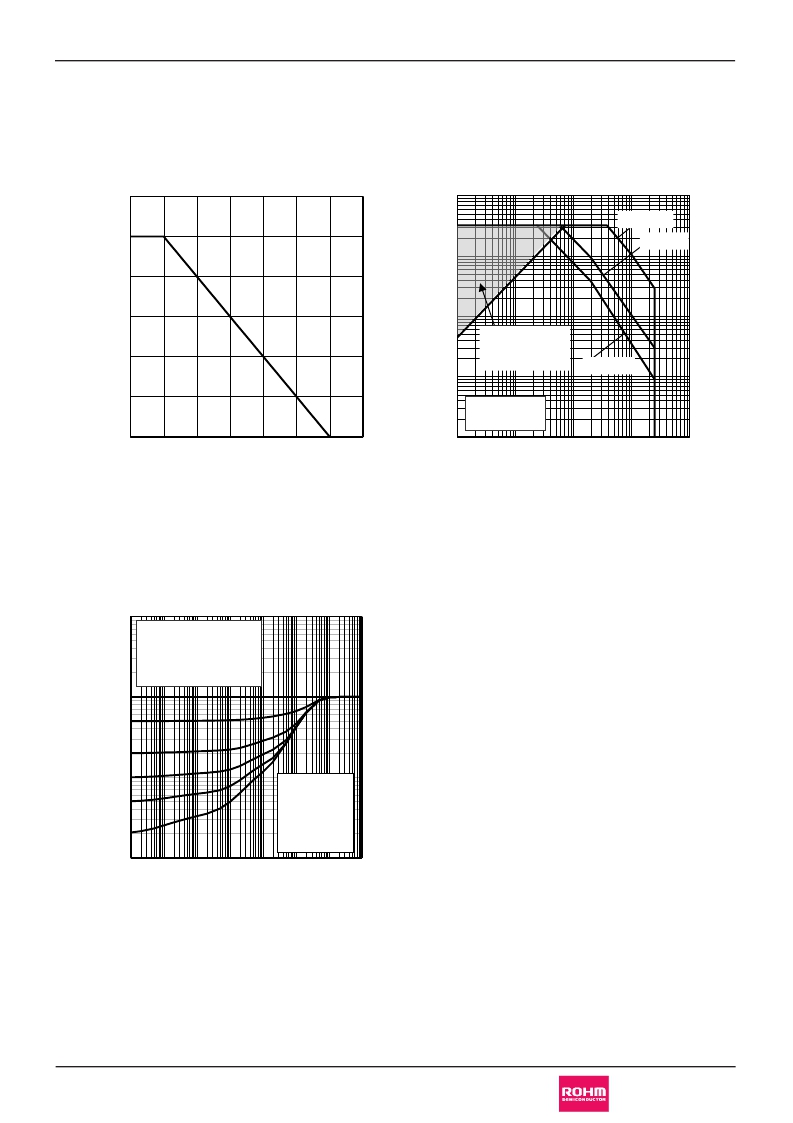
l Electrical characteristic curves
Fig.1 Power Dissipation Derating Curve
120
100
Data Sheet
Fig.2 Maximum Safe Operating Area
100
P W = 100 m s
P W = 1ms
10
80
60
1
Operation in this
40
20
0.1
area is limited
by R DS(on)
T a =25oC
P W = 10ms
Single Pulse
0
0.01
0
25
50
75
100
125
150
175
0.1
1
10
100
1000
Junction Temperature : T j [ ° C]
Fig.3 Normalized Transient Thermal
Resistance vs. Pulse Width
10
T a = 25oC
Single Pulse
R th(j-c)(t) = r (t) × R th(ch-c)
R th(j-c) = 147oC/W
1
Drain - Source Voltage : V DS [V]
0.1
top D = 1
D = 0.5
D = 0.1
D = 0.05
D = 0.01
D = Single
0.01
0.0001 0.001 0.01
0.1
1
10
100 1000
Pulse Width : P W [s]
www.rohm.com
? 2014 ROHM Co., Ltd. All rights reserved.
4/12
2014.01 - Rev.B
发布紧急采购,3分钟左右您将得到回复。
相关PDF资料
RCR-ML-010HT-3
MODULE RCVR REMOTE CTRL HOLTEK
RCX120N25
MOSFET N-CH 250V 12A TO-220FM
RCX330N25
MOSFET N-CH 250V 33A TO-220FM
RD3965MMA7660FC
ZSTAR3 ZIGBEE W/MMA7660FC
RDD020N60TL
MOSFET N-CH 600V 2A CPT3
RF266PC1
RF MODULE 2.4GHZ CHIP
RFD12N06RLE
MOSFET N-CH 60V 18A IPAK
RFD14N05SM9A
MOSFET N-CH 50V 14A DPAK
相关代理商/技术参数
RCD08ML
制造商:TIMEGUARD 功能描述:SOCKET 2GANG RCD LATCHING
RCD08MPV
制造商:TIMEGUARD 功能描述:SOCKET 2GANG RCD PASSIVE METAL 制造商:TIMEGUARD 功能描述:SOCKET, 2GANG, RCD, PASSIVE, METAL 制造商:TIMEGUARD 功能描述:SOCKET, 2GANG, RCD, PASSIVE, METAL; Voltage Rating V AC:230V; Tripping Current:30mA; Trip Time:40ms; Outlet Type:BS 1363; Type:Latching ;RoHS Compliant: Yes
RCD100N20
制造商:ROHM 制造商全称:Rohm 功能描述:10V Drive Nch MOSFET
RCD100N20TL
制造商:ROHM Semiconductor 功能描述:POWER MOSFETS ARE MADE AS LOW ON-RESISTANCE DEVICES - Tape and Reel 制造商:ROHM Semiconductor 功能描述:DIODE SCHOTTKY CPT 制造商:ROHM Semiconductor 功能描述:PWR MOSFET LOW RESIST DEVICE
RCD101AL
制造商:Hubbell Wiring Device-Kellems 功能描述:COMBO, 2) 15A SP ROCKER, AL
RCD101BK
制造商:Hubbell Wiring Device-Kellems 功能描述:COMBO, 2) 15A SP ROCKER, BK
RCD101GY
制造商:Hubbell Wiring Device-Kellems 功能描述:COMBO, 2) 15A SP ROCKER, GY
RCD101I
制造商:Hubbell Wiring Device-Kellems 功能描述:COMBO, 2) 15A SP ROCKER, IV
